When to Buy and Sell Crypto: Complete Timing Guide for Traders
Learn when to buy and sell cryptocurrency with proven timing strategies, technical analysis, fundamental analysis, and market cycle indicators. Master crypto trading timing.
When to Buy and Sell Crypto: Complete Timing Guide for Traders
Perfect timing in crypto markets is impossible, but strategic timing is achievable. This guide covers technical analysis, fundamental analysis, market psychology, and proven strategies for optimizing entry and exit points in cryptocurrency trading.
The Myth of Perfect Timing
Many investors believe there's a perfect time to buy at the market bottom and sell at the peak. This is essentially impossible. Professional traders with decades of experience frequently miss perfect tops and bottoms. Instead, focus on making reasonable trades at sensible prices based on analysis and strategy.
Time in Market vs. Timing the Market
Historical data shows that simply holding cryptocurrency for years significantly outperforms trying to time market movements. Most successful crypto investors are long-term holders, not active traders. However, understanding market cycles and timing can improve returns and reduce losses.
The Cost of Being Wrong
Trying to time the market has real costs. Each failed attempt involves trading fees, slippage (the difference between expected and actual prices), and the emotional toll of making wrong decisions. Many traders would have done better simply buying and holding than attempting to time sales and re-entries.
Technical Analysis for Crypto Trading
Support and Resistance Levels
Support is a price level where buying interest repeatedly prevents price from declining further. Resistance is a level where selling pressure repeatedly stops price increases. Identifying these levels helps determine entry and exit points. Bitcoin has historical support around major previous lows and resistance around previous peaks.
Moving Averages
Moving averages smooth price data to reveal trends. The 50-day moving average shows medium-term trends, while the 200-day moving average indicates long-term direction. When price is above the 200-day moving average, the long-term trend is up. When price crosses below, it signals a potential downtrend. Many traders use moving average crossovers as buy and sell signals.
Relative Strength Index (RSI)
The RSI measures momentum on a scale of 0-100. Readings above 70 indicate overbought conditions where a price correction is likely. Readings below 30 indicate oversold conditions where bounces are common. RSI helps identify when an asset has moved too far in one direction, suggesting a reversal.
MACD (Moving Average Convergence Divergence)
MACD combines moving averages to identify trend changes. When the MACD line crosses above the signal line, it's a bullish signal. Crossovers below the signal line suggest bearish conditions. Many trading strategies use MACD crossovers as entry and exit signals.
Bollinger Bands
Bollinger Bands consist of a middle moving average with upper and lower bands. When price touches the upper band, it's overbought. When price touches the lower band, it's oversold. Price typically reverts to the middle band, providing trading signals. Expanding bands indicate increasing volatility.
Volume Analysis
Volume confirms price movements. Strong rallies on increasing volume are more likely to continue than rallies on declining volume. Breakouts above resistance on high volume are more reliable than breakouts on low volume. Declining volume as price rises often precedes reversals.
Fundamental Analysis for Crypto Investing
Technology Development
Evaluate the technology underlying each cryptocurrency. Is the network improving? Are developers actively working on upgrades? Check GitHub repositories for project activity. Bitcoin has steady development, while newer projects have either rapid development or abandonment.
Adoption Metrics
Track adoption metrics: number of active addresses, transaction volume, and unique wallet addresses. Increasing adoption suggests growing demand. Declining metrics suggest weakening interest. Glassnode and Whale Alert provide on-chain data for analysis.
Regulatory Environment
Monitor regulatory developments in key jurisdictions. Favorable regulations support price increases. Regulatory restrictions or bans create downside pressure. Subscribe to cryptocurrency policy news sources to stay informed about potential regulatory changes.
Competition and Market Position
Evaluate how each cryptocurrency stacks against competitors. Bitcoin dominance (its market share) is a key metric. If Bitcoin dominance increases, altcoin season is ending. If dominance decreases, investors are rotating into altcoins. Monitor these shifts for allocation decisions.
Team and Leadership
For altcoin investments, research the team. Are developers experienced and credible? Does the project have a clear roadmap? Have team members created value in past projects? Be wary of anonymous teams or teams with questionable backgrounds.
Tokenomics
Understand token supply and distribution. Is supply unlimited or capped? Are tokens significantly diluted through ongoing mining or minting? High dilution is bearish. Understand vesting schedules for founder and investor tokens. Large unlocks often precede price declines.
Market Cycles and Timing Patterns
The Four-Year Bitcoin Cycle
Bitcoin often follows a four-year cycle aligned with halving events. The pattern: bull market leading into halving, continued bull market post-halving, eventual peak, subsequent bear market leading toward the next halving. Understanding this cycle helps anticipate major market moves.
Market Cycle Phases
Crypto markets move through distinct phases: accumulation (smart money buying), markup (price rises on growing interest), distribution (smart money selling), and markdown (declining prices). Identifying current phase helps determine whether to buy, hold, or sell.
Altseason Patterns
Altseason occurs when Bitcoin dominance declines and alternative coins outperform. This phase typically follows major Bitcoin rallies. Altcoins tend to boom late in bull markets then crash hard in the following bear market. Timing altseason entries and exits is crucial for altcoin investors.
Volatility Cycles
Volatility tends to follow patterns. After extreme volatility spikes, volatility often declines. Periods of low volatility often precede sharp moves. Understanding volatility cycles helps position sizing: larger positions during calm periods, smaller positions during high volatility.
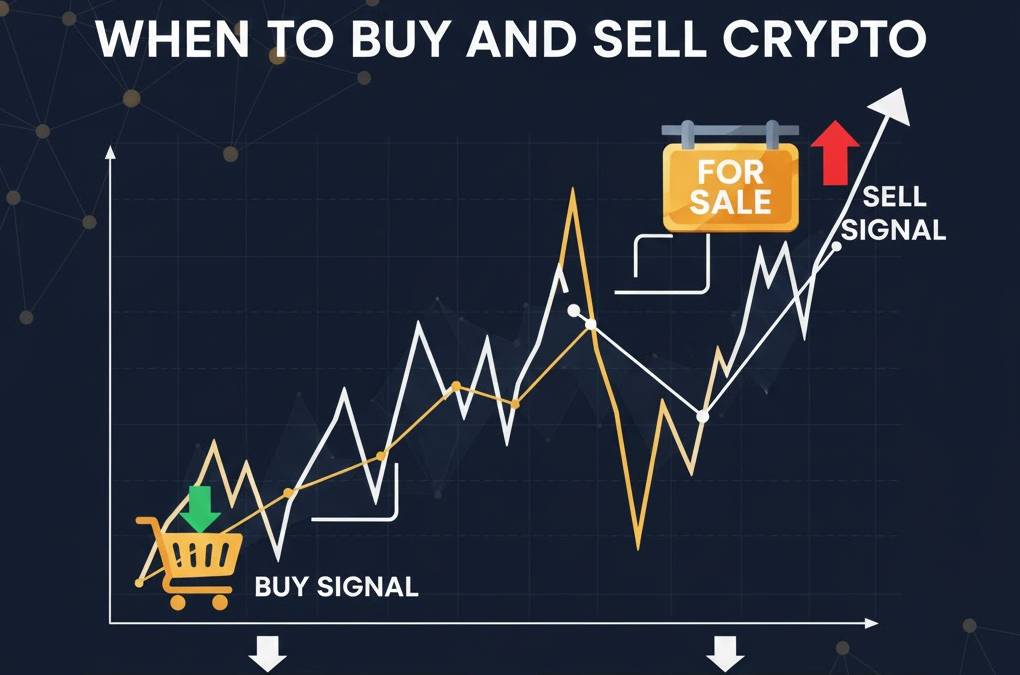
When to Buy Cryptocurrency
Accumulation Strategy
Buy when prices are low and few people are interested. This contrarian approach is emotionally difficult but historically profitable. The best buying opportunities come during bear markets and periods of fear. Look for price targets based on support levels and previous cycle lows.
Dollar Cost Averaging (DCA)
Rather than timing lump-sum purchases, invest fixed amounts at regular intervals (weekly, monthly, quarterly). This strategy removes emotion from entry timing and ensures you buy throughout market cycles. DCA typically produces better results than attempting to time the market.
Dip Buying
In uptrends, buy significant price declines (typically 15-25%). Define before buying how far you expect the price to drop and prepare to buy if it drops further. Have predetermined purchase amounts ready for different price levels. This strategy captures upside while managing risk.
Breakout Buying
Buy when price breaks above resistance levels, especially on high volume. Breakouts often continue for significant distances. Place stops slightly below the breakout level. This approach works well during early bull markets but fails during bear markets and false breakouts.
News-Based Buying
Major news events often create buying opportunities. Positive news that causes price spikes often generates pullbacks as early buyers take profits. Conversely, negative news that crashes prices often creates buying opportunities for patient investors. React counter-intuitively to market sentiment.
When to Sell Cryptocurrency
Taking Profits
Set profit targets before entering positions. If Bitcoin is purchased at $40,000, decide in advance whether you'll take profits at 25% gain ($50,000), 50% gain ($60,000), or another level. Profitable positions create psychological pressure to hold in hopes of larger gains. Predetermined profit levels help you exit winners.
Scale Out Strategy
Rather than selling entire positions at once, scale out gradually. Sell a portion at first target, another portion at the second target, and hold the remainder. This captures upside if the rally continues while locking in profits. A typical approach: sell 25% at 25% gain, 25% at 50% gain, 25% at 100% gain, hold remainder.
Stop Loss Exits
Sell if price closes below predetermined support levels. Stop losses protect against catastrophic losses. Set stops when you buy, not after losses accumulate. Emotional traders often move stops higher hoping prices recover, turning small losses into large ones.
Fundamental Deterioration
Exit if the fundamental thesis changes. If regulatory changes undermine an investment thesis, exit regardless of price. If a project forks or team members leave, reassess whether the investment still makes sense. Don't hold losers hoping fundamentals improve—sell and redeploy capital elsewhere.
Overbought Signals
Sell when technical indicators show extreme overbought conditions. RSI above 80, MACD significantly above the signal line, or price at multiple-year highs suggest sales are warranted. These signals don't mean sell everything, but they suggest booking profits and raising cash levels.
Practical Timing Strategies
Mean Reversion Trading
This strategy assumes prices that move too far from average will revert. Buy when price is significantly below the 200-day moving average, sell when it returns to the average. This works well in sideways markets but fails during strong trends.
Trend Following
Buy when price is above moving averages and rising, sell when price falls below moving averages. This strategy captures large moves but generates many false signals. Use filters like high volume to confirm signals. Trend following works exceptionally well during strong bull and bear markets.
Swing Trading
Hold positions for days to weeks, capturing intermediate-term price swings. Buy support, sell resistance. Use technical indicators for entry and exit signals. Swing trading requires active monitoring but captures profitable moves without the intensity of day trading.
Buy and Hold with Rebalancing
The most accessible strategy for most investors: buy quality cryptocurrencies, hold long-term, rebalance quarterly. This simple approach eliminates trying to time markets, reduces trading costs, and historically produces excellent returns. Most investors achieve better results with this approach than with active trading.
Common Timing Mistakes
Buying Hype, Selling Fear
The opposite of what successful investors do. Most investors buy when everyone is bullish (after prices have risen substantially) and sell when everyone is fearful (after prices have crashed). This locks in losses and misses gains. Do the opposite of what feels comfortable.
Revenge Trading
After a loss, many traders attempt to recover quickly by taking excessive risks. This usually results in larger losses. If you've made a loss, take a break, reassess your strategy, and return with a clear mind. Revenge trading is one of the quickest ways to lose capital.
Holding Losers Too Long
Investors often hold losing positions hoping they'll recover. This ties up capital that could be deployed elsewhere. Set stop losses and exit when stops are hit. Moving on emotionally is difficult but essential.
Missing the 10 Best Days
If you sell during downturns and miss the subsequent recovery, you miss the best returns. Missing just the 10 best days in the Bitcoin market since 2010 would have reduced returns by roughly 80%. This statistic argues for buy-and-hold approaches.
Tools for Timing Analysis
Several tools help analyze cryptocurrency market timing. TradingView provides comprehensive charting and technical analysis. Glassnode offers on-chain analytics. CoinMarketCap and CoinGecko provide market data. Use multiple sources before making trading decisions.
Conclusion
Perfect timing is impossible, but strategic timing improves results. Combine technical analysis, fundamental analysis, and market psychology. Have written plans for buy and sell signals. Execute with discipline, ignore noise, and accept that you'll never buy at the absolute bottom or sell at the absolute peak.
The best trades are often the simplest. Buy quality assets when prices are reasonable, hold through cycles, and rebalance periodically. This boring approach consistently outperforms exciting market-timing attempts by most investors.